
Robert Ferruolo presented at #WLPC US Dallas 2015 about Comprehensive WLAN Testing
You can watch the full presentation HERE.
The Process
It’s all about trying to determine if a used case will work for the customer. All devices and applications are going to work everywhere throughout the whole network all the time. Trying to nail down the used case and then trying your best to model it.
Sometimes, it’s not possible because modeling the environment is probably the hardest thing to do. But, at least you tried to determine what the used cases and then you go for it.
There are obviously different types of testing and you want to use a different type of clients when you do the testing. Just make sure you model it as closely as possible.
High Density

Different types of used cases:
- University Lecture Hall. For the high density of lecture hall, that would maybe categorize as a high density. It can be moderate throughput or high throughput, but it depends on what the application is. This type of used case is something that I could model in the facility that I was in.
- Hotel guest room. You’ll have voice video data, but it wouldn’t be very high throughput because we know that the pipes going out to the Internet where all the services are. Most likely they’re not gonna have voice-video services local, at least not in the US. It would be very high throughput, but make sure a voice video and data work.
- Hospital ICU. They can be high density because you have a lot of devices connected to a single patient. You can’t model exactly the right type of clients most of the time on this type of test. You’d have to partner with the hospitals and face the other challenges. All types of devices are often difficult. But for those type of scenarios, you may be able to get the environment from the hospital you partnered with.
- Electronics Retailers. A lot of times, you’ll see electronics and where they want to stream local content. You can get very high density and high throughput type of environment with streaming video.
- Airport terminals. Airport terminals may be a high density and load throughput where all the clients are limited.
- K-12 video streaming. This is a big part of the curriculum in lots of schools. The content can be fairly high quality but not very high-density. It is moderate density but with high throughput per device.
Tools for Traffic Simulation

We use Jperf for traffic simulation, but we’d like to use lxChariot. If you work for a vendor or a bar and you’re preparing your team for a bake-off, you may actually have to do the testing with Iperf if that’s all they have.
Monitoring and Analysis

Monitoring and analysis are the tools that I would have opened all the time while I’m doing the testing. Most of the testing has done in the last several years in open-air.
You have to watch those channels like a hawk. The building that we had for doing the testing in the past was far enough away from neighboring buildings.
If you have a channel or two channels, set aside for your performance testing. You have to watch those channels all the time.
If someone jumps on those channels or if there’s non-Wi-Fi interference on them, it would invalidate your results, so watch those very carefully.
Clients
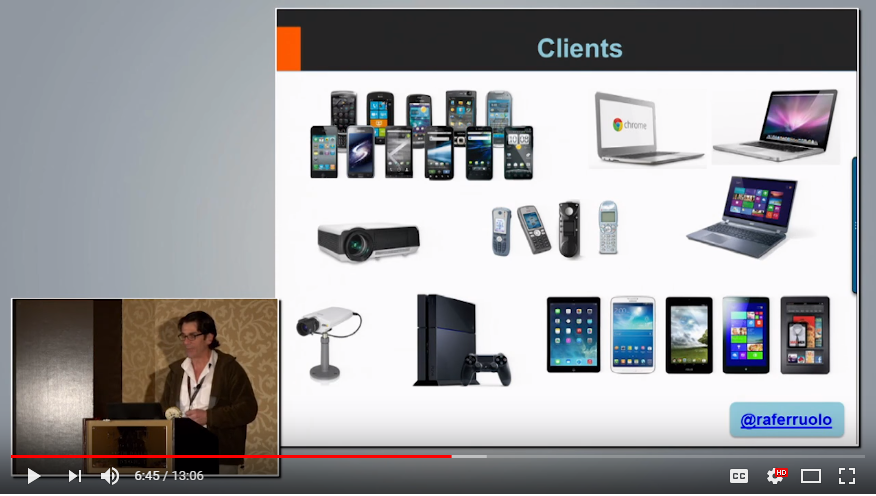
As far as clients is a concern, we try to build out the lab as much as we can with a diverse set of clients. We model what our customers would be using.
I put a PlayStation there because actually in higher education, you’ve got to get those PlayStations working right in the dormitories.
Applications

For the applications, there are so many that you can use. We try to use the applications that the customer might use. We use Windows and we tested them with the links and we used FaceTime for doing video conferencing.
VLC seems very popular and it’s great for sourcing multicast or unicasts over HTTP. We use Windows Media streaming server mainly for sourcing unicast over RTP.
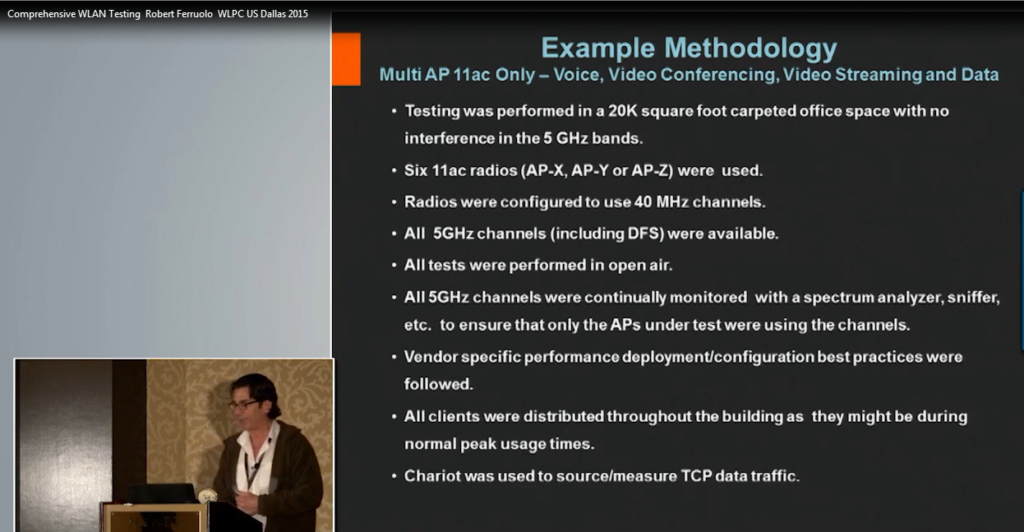
This is an eye chart. We’d have a slide or two or three setting the parameters. How we tested it? How many APs and channels did we use? Which application did we use to source the traffic and learn about the clients?
Example of Test Cases: Multi-AP
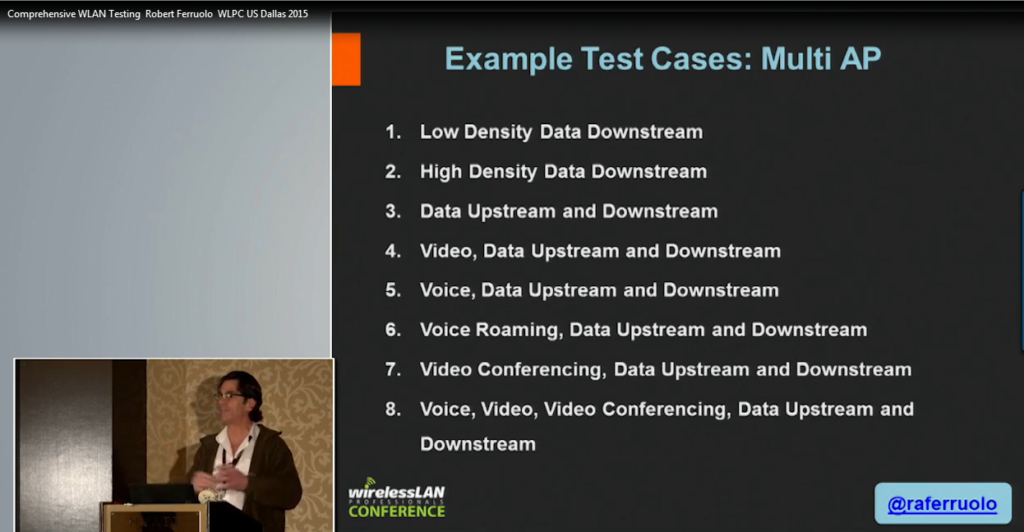
1. Start with a low density to get an idea of the capacity. You wouldn’t have very many clients for radio in that case.
2. Go to a high density where you would have a lot of contention.
3. I have data downstream and upstream. We used to have a 9 to 1 ratio. But, as applications change with social media, that ratio has changed. As the upstream is growing you want to model those patterns.
4. Video, data upstream and downstream.
5. Voice, data upstream and downstream.
6. Voice roaming, data upstream and downstream
7. Video conferencing, data upstream and downstream
8. Voice, video, video conference, data upstream and data downstream.
If you’re using lxchariot, you can save your data in a CSV and sort it. If you’re trying to see if your clients will meet an SLA, you actually take them, then you can sort them from best performer to worst performer.
You can see that the red line looks pretty much on average. Each type of clients is getting the same amount of throughput. The blue line represents when you have these lesser capable clients.
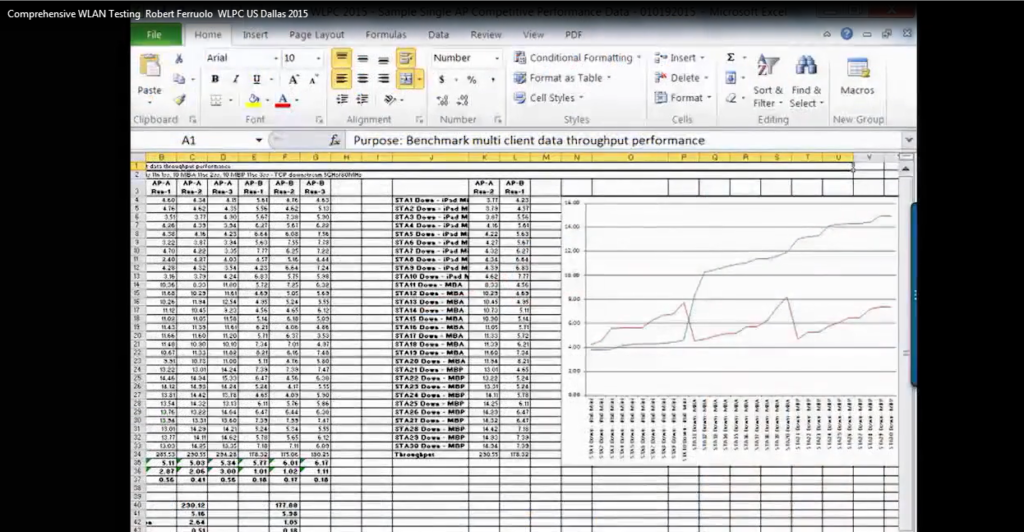
If you sort the traffic, there are a couple of things you can reveal and you can get your graphs and do your reports and present your data.

Robert A. Ferruolo is a Sr. Technical Marketing Engineer at Mojo Networks. If you have more questions or feedback, connect with Robert via twitter.
Go HERE to watch this entire presentation.
