
How do you explain “Packet Analysis” so your clients can understand what’s really going on?
Joel Crane (CWNE #233) gave a presentation at #WLPC Phoenix 2018 overviewing the metageek’s Eye P.A.
During his presentation he gave a great overview of the “basics” of what is actually happening with packets in WiFi in a way even a novice can understand.

Joel is a sales engineer and technical trainer at Ekahau. But before joining the Ekahau team, Joel spent the past 5 years with Metageek. During his time there he really got to know, and appreciate Eye P.A. Here are some of the highlights from that presentation.
Back to the basics!
What we’re gonna do here when we talk about packet analysis with Eye P.A. is what you do with algebra, what you do with math. We’re going back to the very beginning.
I’m going to start at the absolute basics and we’re just going to fly through that stuff as quick as we can. Then we’re going to jump into actually using Eye P.A. and looking at what it looks like to perform air time analysis with Eye P.A..
There are 3 main types of interference.
- Co-channel Interference: that’s where we have a bunch of client devices and AP’s will just call those stations on the same channel. They’re all going to compete for opportunities to talk.
- Adjacent Channel Interference: which occurs when we have AP’s and client devices on overlapping channels. When that happens, they don’t politely get along. They just interrupt each other which is going to cause a frame corruption and all kinds of issues.
- Non Wi-Fi Interference: things like cordless phones, wireless video cameras, microwave ovens. In the 5GHz band we’re seeing some fun stuff now like drone cameras. But we’re starting to see some of these things that even up in the five years span, when they get on a channel they “just get on a channel”. They don’t care what’s already transmitting, they just start talking. When that happens, a Wi-Fi device can’t transmit. It can’t do anything!
Remember the most important thing to understand about Wi-Fi is that on any given channel, at any given time, only one device can talk.
We’ve got an access point here and it needs to talk…
The first thing it’s going to do is do a clear channel assessment. It’s just going to listen to see if there’s anything on the channel. And if there’s nothing there, it will take that opportunity to transmit some data.
On the other side, the laptop will receive that data and it’ll say, “Let’s take a look at it and see if it’s legit” and if it’s good, it’ll say, “I understood that data” and it’s going to reply with an acknowledgment.
Now there’s a couple of things that can go wrong here…
The access point transmits the data but the data just never quite makes it to the laptop.
When that happens, the access point is not going to hear an acknowledgement and will start saying, “I never heard anything back from the laptop so it must not have received the data frame.” It’s going to transmit that data again and again and again. It’s going to keep trying to get that data through to the laptop.
I like to think that Wi-Fi is a lot like my three-year-old daughter in this way.

I’ve got three daughters, the oldest is six, the youngest is three. They’ve all gone through this stage where they have lots of questions. Let’s say that she’s an access point for a second. Let’s see what it’s like when we compare her to an AP or to a client.
If I’m sitting on the couch and I’m reading a book and she says something to me and I don’t answer, what is she going to do? She’s going to “retransmit” again and again and again until finally, something makes it through to me and I give her some kind of acknowledgement. Kids are just like Wi-Fi devices.
Kids are just like Wi-Fi devices.
The big takeaway from this is that on any given channel, at any given time, one device talks.
We hear vendors out there that say “my Access Point supports 500 clients or a thousand clients”. It’s not really about what the AP’s supports. We’ve got enough processing power, we’ve got enough RAM. It’s about the channel. What can we support on the channel?
Let’s say that we’ve got an Android phone here and it’s transmitting something to this access point. While that transmission is occurring, everything on the channel has to basically shut up and be quiet. On any given channel at any given time, one device talks at a time.
How do we see what’s going on the spectrum?
Well, here’s a couple of traditional ways of doing it.
- A Wi-Fi Scanner
A Wi-Fi scanner just uses a plain old normal Wi-Fi adapter to scan for wireless networks. That’s nice because we could see some pretty interesting pieces of information. We can see there are a couple of AP’s on this channel. We can see there is some co-channel interference here. We can get some good pieces of information out of that. - Spectrum Analysis
that’s when we really kind of ramp up what we can see in the air. There’s a couple more really critical pieces of information that we get with spectrum analysis. The first one is that we can see interference from non 802.11 devices. The cordless phones, the video cameras, all that stuff. We can see anything that chirps in the spectrum. We can also see 802.11 channel congestion. We can see how often Wi-Fi devices are talking, how often they are utilizing the channel, how busy they’re keeping that channel.
There’s basically two steps when you’re troubleshooting an issue between an AP and a client device.
- Step 1. Look for a NON Wi-Fi signature. If you see a non Wi-Fi signature, you’re going to use spectrum analysis to take a closer look at what’s going on. That’s where you’re going to stop if you see a cordless phone. There you’re going to seek and destroy. You’re going to try to get rid of that. You’re not going to move on to another tool.
- Step 2. Look for a Wi-Fi signature. If you see heavy utilization that looks like Wi-Fi, if you see a Wi-Fi signature, it’s time to put the spectrum analyzer away and move up to Layer 2. It’s time to look at the packets to see what is actually happening in in that environment.
Packet analysis helps us answer a few questions…
- Who is talking slowly?
- Who is talking the most?
- Who is repeating themselves all the time?
One thing we really have to watch out for in Wi-Fi are slow data rates. For example, let’s say that we have an Android phone here and it’s nice and close to the AP so they’re able to have a conversation at a signaling rate of like 65Mbps. Then we’ve got this other Android phone that’s way on the fringe of the coverage cell so it’s had to back off and slow down to 1 Mbps. This 1 Mbps device is going to talk 65 times slower than the device that’s close to the AP.
Packet analysis helps us look at all of those details of 802.11 congestion on a channel.
I like to think of utilization and air time as basically two separate measurements of something very similar.
- Utilization, I see that as a layer 1 measurement. That’s the percentage of time that we saw RF (Radio frequency) in the air. That’s how often we heard RF in the in the air on that channel, at that frequency.
- I like to see airtime as a layer 2 measurement. That’s the percentage of time that 802.11 devices reserved time on the air.
Let’s take a look at the four different types of frames that we will see in wireless
- Management frames
- Authentication frames
- Control frames
- Data frames
By the way, if you forget which major frame type corresponds to which frame subtype, Eye P.A. and the filters bar has this really sweet cheat sheet built-in. You can just drop that menu down and you can look at that and go.
Management Frames.
Management frames basically help stations join and leave wireless networks. Some examples of that are a beacon. A beacon is just an access point announcing that it exists. For example, my old Aerohive AP330 on the ceiling at home, right now is sitting there going “Hey, I’m Joel’s Network, I’m here”. That’s a beacon. It’s just an announcement of an access points existence.
That’s a beacon. It’s just an announcement of an access points existence.
I like to think of a probe as kind of the opposite of a beacon. That’s when my device looks for familiar networks. As I’m walking down the street it might be going “Hey, Joel’s Network are you there?” Then it’ll move on to the next device in the list, looking for familiar networks.
Authentication Frames
Authentication frames are a hold over from WEP. They’re kind of a formality – association frames which are part of the process of us actually getting connected to a network.
Control Frames
Control frames basically control the RF medium and make sure other frames get delivered.
- The first is an ACK. We transmit data, we receive an ACK. Which is what my daughter is looking for if she comes up and shows me the pretty picture that she drew of the flowers. Then I’ve got to give her some kind of acknowledgment or she’s gonna keep trying to show me that picture until I acknowledge it.
- The next type is a block acknowledgment. That’s when we can basically acknowledge a lot of data frames at the same time. Instead of going, “data acknowledgement, data acknowledgement, data acknowledgement.” We can go, “Data, data, data, data acknowledgment. Data, data, data, data, data acknowledgement.”
- Then there’s RTS CTS. “Request to Send”; “Clear to Send”.
I had a great example of RTS CTS happen in the office at Metageek.
I was standing in the doorway between the main office and our little kitchen. One of my colleagues was standing at the sink and another was sitting at his desk in the office area. All of a sudden they both start talking to me at the exact same time. I had to say, “Hang on guys both of you are talking to me at the same time.”
That is an example of a hidden node problem. If I’m the AP and they’re the clients they can’t hear each other but I can hear them and they both interrupted each other. I couldn’t decode any of the frames from them. I couldn’t understand what they were trying to say. I had to say, “hang on a second, one at a time.”

If we’ve been using RTS CTS, here’s what the conversation would have looked like…
- First coworker, ”Joel can I ask you a question?”
- Joel, “Yes, you may ask me a question.”
- Second co-worker, “Oh, Joel’s already talking to somebody. I need to back off for a minute.”
That’s RTS CTS in action.
Data Frames
The final frame type is data frames. This is the actual data on the network. These are the only things carrying any data to make it on to the wired side of the network. This is the whole reason why we have wireless networks. There are three main types of data frames:
- Data Frames
- Quality of Service Data Frames
Where we attach some kind of priority to a frame. We can do things like deliver voice over IP frames first and let the Facebook page wait a little bit longer to load. Because Facebook doesn’t need to be delivered as quickly. - Null Data Frames
Those are for things like Power Save Poles. They’re not “actually” a data frame, but here they got shoved into this category.
How devices determine who is going to get to talk next.
The next thing I want to talk about is how devices determine who is going to get to talk next on the air.
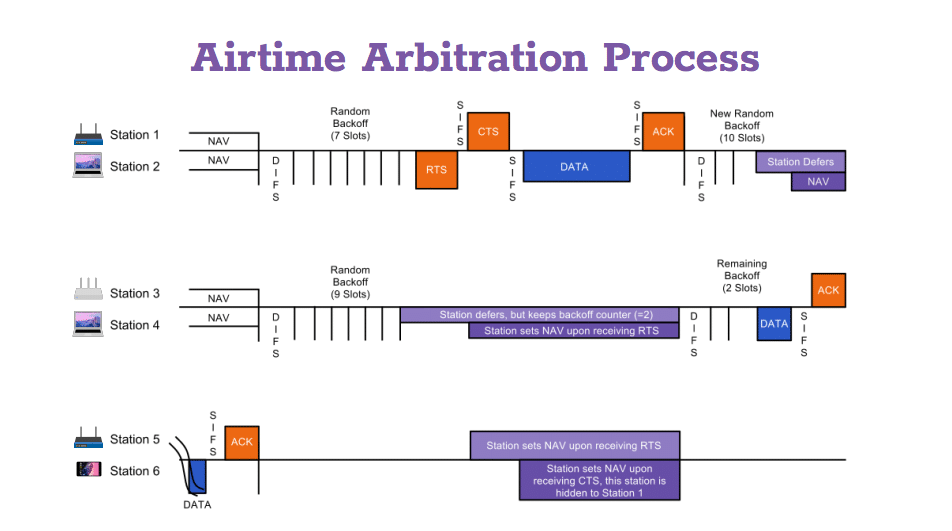
Let’s say we have six stations, the station can be either an access point or a client. It doesn’t matter it’s just one of those two things.
We can see what happens over time. Let’s start out with station 5. Station 5 is just finishing up sending up some data. Then there’s a short inner frame spacing. Basically just a little breath a little break in the air. Station 5 is going to transmit its acknowledgment to say “okay, got your data. We’re done with their transmission.
Now station 4 and station 2 have both been watching the channel. Waiting for an opportunity to talk. They both see a DIFS – this little slice of time where nothing happens and that’s a signal to both of them. There’s an opportunity. “I might be able to transmit here.” When that happens, in their own heads, they are each going to pick a number. They’re each going to roll the dice and pick a number.
Station 2 is going to pick a “7”. Station 4 is going to pick a “9”. Then they are each going to count in unison “1, 2, 3, 4, 5, 6, 7”. When station 2 hits “7” it will say, “Sweet! I counted to 7 and nothing talked. It’s my turn to talk.” It’s going to transmit its RTS – it’s request to send.
Meanwhile station 4 counted, “1, 2, 3, 4, 5, 6, 7… It’s not my turn to talk. It’s gonna back off.” It’s going to defer to the other client and wait for an opportunity to talk. I’m simplifying a little bit. But that is kind of the gist of how it works. When station 2 transmits its RTS it signals to everything else in the channel, “I’m going to reserve some time on the air.”
Now station 1 is going to transmit a clear to send. That’s gonna let these guys know, “Everybody synchronize your watches for x amount of time. I am reserving this much time on the air for this conversation.”
Now we’re gonna go ahead – station 2 is going to transmit its data. Station 1 is going to reply with an acknowledgment. “We’re done! we’ve used up our slice of time that we reserved on the air to talk.”
Remember how station 4 tried to get an opportunity to talk and didn’t make it?
He only had two “back off slots” remaining. Now he only has to count to “2”. Now it doesn’t guarantee him access to the medium, but he’s got a way better shot now than he did before. He’ll count, “1, 2.. Nothing started talking. It’s my turn to talk.” It’ll go ahead and transmit its data. Which will cause station 2 to defer. Station 3 will send the acknowledgement.
That’s what the airtime arbitration process looks like.
But how do we visualize this?
How do we see what’s going on? Now Wireshark is one of my favorite tools ever. It’s awesome. But the problem with Wireshark is it’s really difficult to visualize air time usage – what is actually happening on the air? Who is talking fast? Who is talking slow? Who’s repeating themselves?
This is where Eye P.A. comes in. With Eye P.A. we basically get a multi-layered pie chart that shows us how often everything talked.
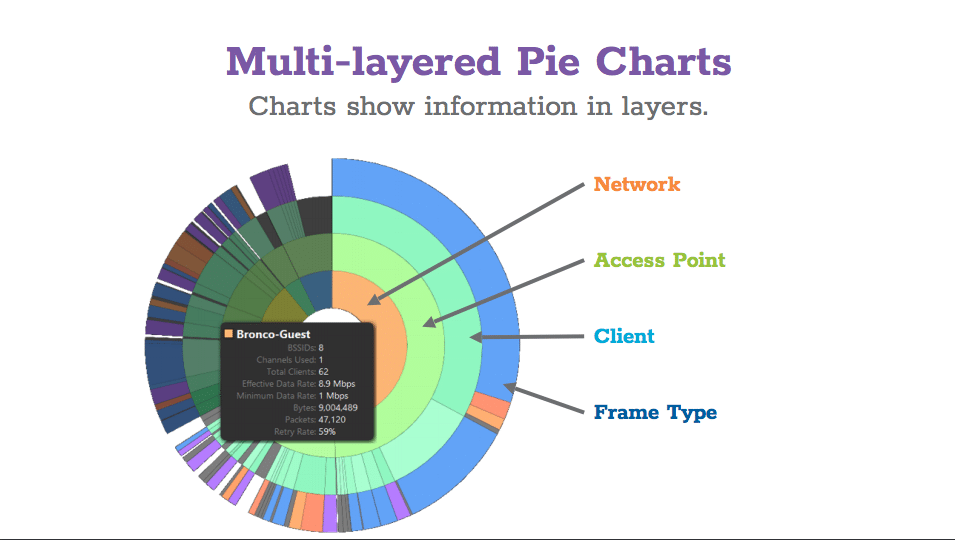
Let’s take a look at what these multi-layered pie charts look like. This pie chart represents 100% of the air time that was used on that channel. Then if we break it down into the different layers we can see what talked, what used the airtime on that channel.
Let’s look at this chart going from the inside out
- The inside layer is our network.
Now a network can be composed of many many access points as you know. If you’ve got more than one AP on a channel that can hear each other then you may have a problem there. That might be a bad thing. We can show multiple APs nested above this network layer. - Now if we go one more layer out we’re looking at the individual access points. You can see that one of the access points used up about half of the total amount of air time on the channel during this packet capture.
- The next layer is the client device. One of these client devices used up about a third of the time on the channel.
- The outermost layer shows us the frame type.
Basically we give a color to each individual frame type.
- Orange are control frames like our acknowledgments and block ACKS and our RTS/CTS.
- Purple is management overhead like beacons and probe responses. If you do a packet capture of your wireless network and you’re using like 50 to 60% of your airtime, it’s all being eaten up by management overhead, you’re gonna have a bad time.
- Blue is actual data – which is a really good thing, that’s actual time that we spent moving data across the network.
Joel went on to provide a demo of the Eye P.A. tool in action