
Well – I saw this abomination of a chart from a recruiting agency used by the CWNP marketing department to help sell more certifications. Now I, for one, am quite proud of the CWNP program and strongly encourage everyone in this business to become certified. But I don’t believe for a minute the salary ranges as given in this chart!

So rather than just complain about it – I worked with Donal O Duibhir of PanSift to build a survey instrument to capture more realistic information from the Wireless LAN Community. We had nearly 1,000 responses to this benchmark, more than enough to have very valid statistically accurate results. The instrument had 15 total questions and we received global results. This was vendor-agnostic, and certification agnostic as well. The goal was to find out about total compensation. We left that definition up to those responding – we merely asked about their “total compensation”. We asked questions we initially thought were important – yet after some study and analysis, we realized many were, if not wrong, misleading in the results. We did not ask for city/state/country level geographic questions – so someone living in Arkansas and getting paid a Silicon Valley wage might be a bit misleading. But we didn’t know up front if we’d have enough data from each geography to have statistically significant enough sample sizes to get legitimate answers.
Though many of our questions had merit – sadly some did not.
Correlation vs Causation
As a reminder – just because we have statistically significant data showing strong correlations… does NOT mean there is evidence of causation.
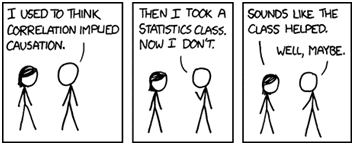
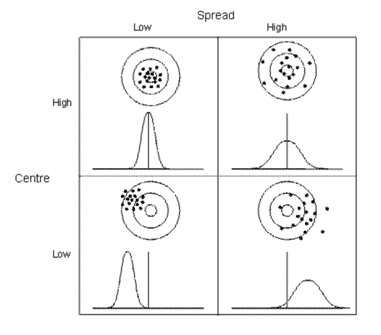
As a quick reminder – there are a couple of words we use in statistics that have different meanings – so here is a quick refresher of these terms, but totally in graphical format. I’m assuming the readers of this document will be familiar with these terms – yet perhaps needed a quick reminder.


Here are the results of the benchmark – at least a smattering of the results that might help make sense of the nearly 1,000 responses.

We had assumed more people taking the survey would have been independent or working freelance jobs. But bulk of all responses came from fully-employed individuals.

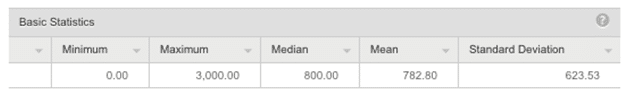
The overall global average of total compensation was $104,000 in equivalent US dollars. But this is very misleading. There are huge variations in this average for a variety of situations.
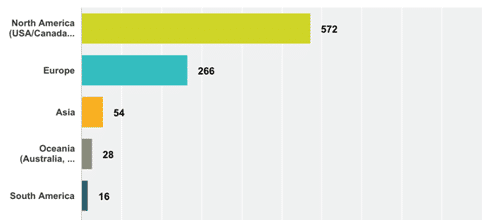
The bulk of the responses are from North America, but still statistically significant results from Europe and Asia.

Age played a bit in the outcome – but only to differentiate between the young, <30 and the older folks who were >50. The bulk were middle aged.

We had initially assumed this would show those on commission to be paid perhaps a bit more because of being on the sales side… but it didn’t work out as we’d thought. On balance, only 10%-12% of those surveyed had a total compensation plan tied to a commission. Our initial assumption was this would show who worked as a Sales Engineer and their salaries may be higher. Results showed no significant difference because of this factor and this was not a predictor of compensation.
We had initially thought more people would respond with much higher figures for the costs of an Average Daily Rate for a Wireless LAN Professional. In the end, it works out mathematically to be very close to the global average salary.
Average of $104,000 / 2,000/year X 8 hour/day X 1.9 = $790/day
 Initial assumption was many higher earners would have ‘side jobs’ to augment their incomes. Yet survey results showed this was not a significant factor, nor a predictor of compensation.
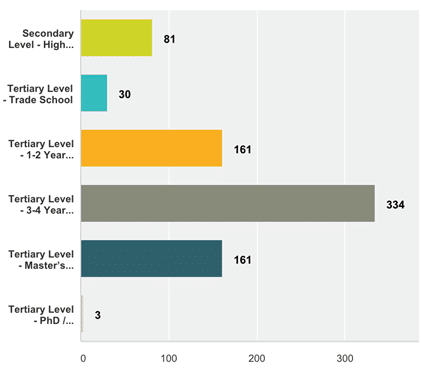
Though I personally believe more education is better for each individual, and for society as a whole, the data showed a significant number of Wireless LAN practitioners are paid quite well even without a 4-year college degree, and even more education tends to be represented by lower compensation.
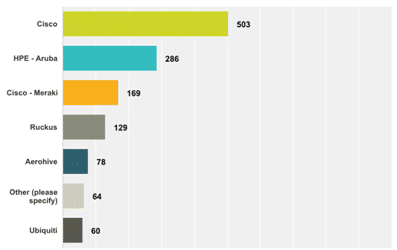
We’d thought there might be a difference in wages of those who support one of the top three providers of Enterprise-Class Wi-Fi gear, and the other segments. The data held this to be quite true. Though it was not enough to be ‘predictive’ in nature. But it was a significant difference.

This compensation benchmark was initially triggered by the CWNP salary survey graphic. The assumptions of certifications, or combinations of certifications, would have a correlation effect with overall compensation was proved incorrect. Though you can see a large difference between certifications – no correlation was found at all in the data.

Thus, we could not use certification to predict compensation. No consistent correlation between the two existed. Yet there were significant and consistent differences between different certifications.

People in the US/Canada receive on average 47% more in annual compensation compared with other regions.
We added this metric in quite late in the design of the survey instrument – and we are glad we did. This turned out to be a HUGE variable in overall compensation. 
For each additional night away from home, 4% is added to overall compensation. 3 nights away from home = 12% – and by the time you get to 15 nights away from home, it adds 44% more when compared with same situations – just with no nights away from home.
We are NOT suggesting those with young children at home to go and take a job with more nights away from your family to get more income. This is merely a correlation of data factors, with no causation implied.


Note a rising pattern with years’ experience – then a slight dip in the end.

We performed a series of regression analysis – a statistical measure that attempts to determine the strength of the relationship between one dependent variable (usually denoted by ‘Y’) and a series of changing variables (known as independent variables) We are trying to see if there is a set of coefficients that may be used to show strong correlations between variables and results. 
Many of the questions we asked ended up not having any predictive power – no correlation to total compensation in a consistent manner. These were not included in the regression analysis for lack of mathematically predictive power.
Other factors, did have quite a strong correlative value and were useful in predicting total compensation. These include:
The use of these predictive factors allowed us to achieve a level of about +/- 10% of all correlative value within 2 standard deviations. Meaning – about 95% of all total compensation results could be shown to be within +10% or -10% of the results of our salary calculator.
Here is the formula for estimating total compensation based on these predictive values – we built it into an Excel spreadsheet.

Then, with the help of Blake Krone – he was able to take these calculations and build an online salary calculator to do the same things.

You can try this on your own at https://wlancomp.com/
We found some very interesting results from this benchmark survey of people involved in the Wireless LAN industry. Many of our initial assumptions were proved false – and the CWNP salary survey proved to be a bit incorrect – if not totally wrong for those who don’t live in the US/Canada.
We ended up with the ability to predict within +/- 10% of what 95% of people responded with using only 5 significant factors.
Now if anyone in the industry needs to do a comparison, there is an online calculator to help in their salary calculations and perhaps negotiations.
Perhaps we’ll do this as an annual event and see how total compensation, and the associated predictive factors change over time.
