We’ve all seen the design specs calling for Access Point overlap of some 15% to 30% depending on who’s talking. I think this is just pure *&^#@…
If you can not measure it… then don’t use it in your design spec!
Someone telling you, “I’ll know it when I see it” just isn’t good enough. We need to be able to PROVE or VERIFY that our wireless networks meet a design specification.
Calculating Channel Overlap
Might I suggest that no one has calculated this ‘overlap’ properly? I, for one, don’t have the math skills necessary to do it properly.
Here’s an example (we’ll start out with an easy one)
This picture obviously represents 0% overlap or no overlap at all.
Ok, now for a bit harder…
What is the overlap here?
Don’t jump right to your foregone conclusion… Let’s think about it first…
This is:
50% overlap of Diameter
100% overlap of Radius
29% overlap of Circumference
23% overlap of Area
The calculation to get the Diameter and Radius were pretty much brain-dead easy… but the other two, not so much…
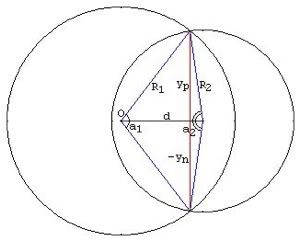
Here’s just the example for the calculation of area when two circles intersect.
With the following associated formula:
Getting to Reality
Are telling me you do this calculation for each and every access point where it intersects with another one of your access points in your WLAN designs? I think not.
Not to mention, access points radiation patterns are never ‘really’ circles but normally look more like amoebas or starburst type patterns… do you even know how to start calculating those areas’ overlap?
So again, If you can’t measure it, then don’t include it in your design specs!
What you CAN calculate, and SHOULD be using, is the effect of overlap on individual clients. You can use this calculation to ‘prove’ or ‘verify’ that your WLAN design is meeting the actual design spec of your specific STA (device).
In AirMagnet Survey, this is found in AirWise and set the requirement for 2 access points at say -67dBm.
It’s pretty easy really. The reason we have this ‘overlap’ thing is to make sure the STA’s have adequate duplicate coverage. In other words, each STA needs to see at least one access point at a specific RSSI, and a ‘backup’ or secondary access point at a different RSSI.
Some vendors spec the same for both the primary and secondary – like some VoIP phones want to see a primary at -67dBm and a secondary also at -67dBm – or in other words – two at -67dBm.
Now this we can easily measure!
Just complete a passive survey with your favorite tool of choice and ask the system to show where in your network coverage areas you see TWO access points with a signal greater than -67dBm.
No more trying to guess on percent overlaps, no more making up some ‘eyeball’ answer. Just a plain and simple answer to the question –
Do I have adequate coverage to meet the design specifications of my client (STA) devices?
By the way – you’ll need to do a survey following all the rules of proper surveying. Of course, you always follow the rules, right?
Conclusions
Don’t pretend to be able to calculate access point coverage overlaps using a graphic based on area. Look at this from the client’s point of view, and make sure you have the correct RF everywhere to meet the ‘backup’ needs of the clients.
The WLAN Iconoclast
Keith at inpnet.org
March 28th, 2009
Orem, UT, USA
Additional Articles for Supporting WLAN Site Surveys
– 7 Rules for Accurate Site Surveys
– How to ‘Cheat’ On A Survey – Don’t be a Victim
– How to Properly Analyze Survey Data
– The Fallacy of Channel Overlap
– Predictive Survey vs Onsite Survey – What’s the Big Deal?
– How to ‘Spec’ your Network’s Physical Layer
– Want, Don’t Want, Don’t Care – Meeting Design Specs
– The Truth about SNR – Where Did that ‘N’ Come From Anyway?
– What is an Access Point Anyway – Hub, Bridge, Switch or Router?
– Passive vs Active – What’s All the Fuss About?
– The False God of dB
– Meeting All Device Design Parameters


